Equilibrium Graphs

Three types of graphs appear in NSC exams for chemical equilibrium: reaction rate vs time, concentration vs time, and number of moles vs time. Each one shows how a reversible system responds to a disturbance before settling at a new equilibrium.

Chemical Equilibrium
Reference reaction
\(\text{A}_{(g)} + 2\text{B}_{(g)} \rightleftharpoons \text{AB}_{2(g)} \quad \Delta H < 0\)
→ exothermic (forward) ← endothermic (reverse)
Why concentration ∝ moles
\(c = \dfrac{n}{V}\)
If volume is constant, \(c \propto n\). The concentration vs time and no. of moles vs time graphs have exactly the same shape — only the y-axis label changes.
The three graph types
  • Reaction rate vs time — forward and reverse rates converging and diverging
  • Concentration vs time — how [reactant] and [product] change over time
  • Moles vs time — identical shape to the concentration graph
01

Reaction Rate vs Time — Temperature Disturbance

Le Chatelier's Principle
Reaction rate vs time graph showing forward and reverse rates approaching equilibrium, then responding to a temperature increase at t₁ and a temperature decrease at t₂
1
Before t₁ — reaching equilibrium
The forward rate starts high and decreases. The reverse rate starts low and increases. Both converge to the same rate — dynamic equilibrium is established.
2
At t₁ — temperature increase
An increase in temperature increases the rate of both the forward and the reverse reactions. According to Le Chatelier's principle, an increase in temperature will cause the system to counteract by decreasing the temperature. An increase in temperature favours the endothermic reaction and therefore equilibrium will shift to the left. The rate of the reverse reaction will therefore increase more than the forward reaction for a short while, until a new equilibrium is established.
3
At t₂ — temperature decrease
A decrease in temperature decreases the rate of both the forward and the reverse reactions. According to Le Chatelier's principle, a decrease in temperature will cause the system to counteract by increasing the temperature. A decrease in temperature favours the exothermic reaction and therefore equilibrium will shift to the right. The rate of the reverse reaction will therefore decrease more than the forward reaction for a short while, until a new equilibrium is established.
Key rule

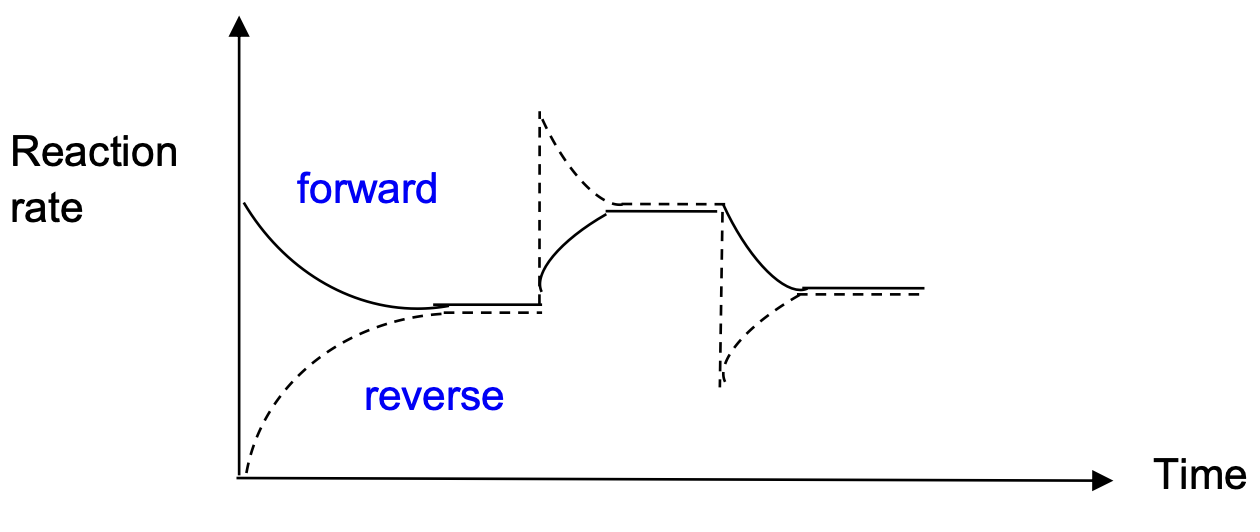
At equilibrium, forward rate = reverse rate — the two curves are equal. The curve that changes more at a disturbance reveals the direction of shift: if the reverse increases more, the system shifts left; if the forward increases more, it shifts right.

02

Reaction Rate vs Time — Pressure Disturbance

Le Chatelier's Principle
Reaction rate vs time graph showing forward and reverse rates at equilibrium, then responding to a pressure increase at t₁ and a pressure decrease at t₂
1
Before t₁ — at equilibrium
The forward rate and the reverse rate are equal — dynamic equilibrium is established.
2
At t₁ — pressure increase
An increase in pressure increases the rate of both the forward and the reverse reactions. According to Le Chatelier's principle, an increase in pressure will cause the system to counteract by decreasing the pressure. An increase in pressure favours the reaction that produces the least number of moles and therefore equilibrium will shift to the right. The rate of the forward reaction will therefore increase more than the reverse reaction for a short while, until equilibrium is once again established.
3
At t₂ — pressure decrease
A decrease in pressure decreases the rate of both the forward and the reverse reactions. According to Le Chatelier's principle, a decrease in pressure will cause the system to counteract by increasing the pressure. A decrease in pressure favours the reaction that produces the most number of moles and therefore equilibrium will shift to the left. The rate of the forward reaction will therefore decrease more than the reverse reaction for a short while, until equilibrium is once again established.
Key rule — counting moles

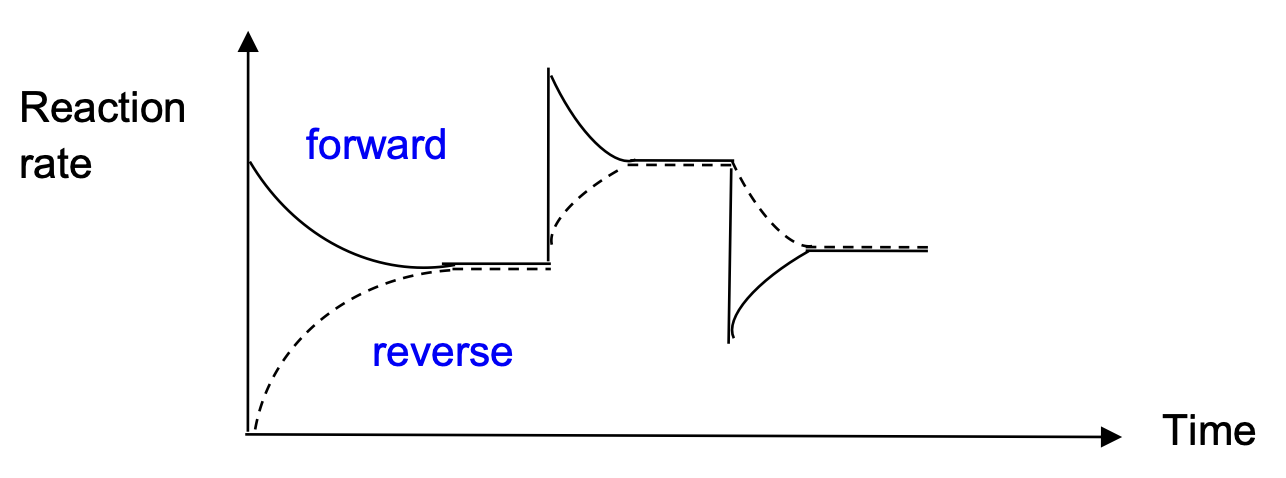
For the reaction \(\text{A}_{(g)} + 2\text{B}_{(g)} \rightleftharpoons \text{AB}_{2(g)}\): the left side has 3 moles of gas and the right has 1 mole. Increased pressure always shifts equilibrium toward the side with fewer moles of gas.

03

Reaction Rate vs Time — Concentration Disturbance

Le Chatelier's Principle
Reaction rate vs time graph showing forward and reverse rates responding to an increase and then decrease in reactant concentration
1
Before t₁ — at equilibrium
The forward rate and the reverse rate are equal — dynamic equilibrium is established.
2
At t₁ — concentration of reactant increased
If the concentration of one or more of the reactants is increased there will be more collisions taking place and the rate of both the forward and the reverse reactions will increase. According to Le Chatelier's principle, when the concentration of one of the reactants is increased the system will react in such a way to decrease the concentration. The reaction using up the extra reactants will be favoured and therefore equilibrium will shift to the right. The rate of the forward reaction will therefore increase more than the reverse reaction for a short while, until equilibrium is once again established.
3
At t₂ — concentration of reactant decreased
If the concentration of one or more of the reactants is decreased there will be fewer collisions taking place and the rate of both the forward and the reverse reactions will decrease. According to Le Chatelier's principle, when the concentration of one of the reactants is decreased the system will react in such a way to increase the concentration. The reaction that produces more reactants will be favoured and therefore equilibrium will shift to the left. The rate of the forward reaction will therefore decrease more than the reverse reaction for a short while, until equilibrium is once again established.
Key rule

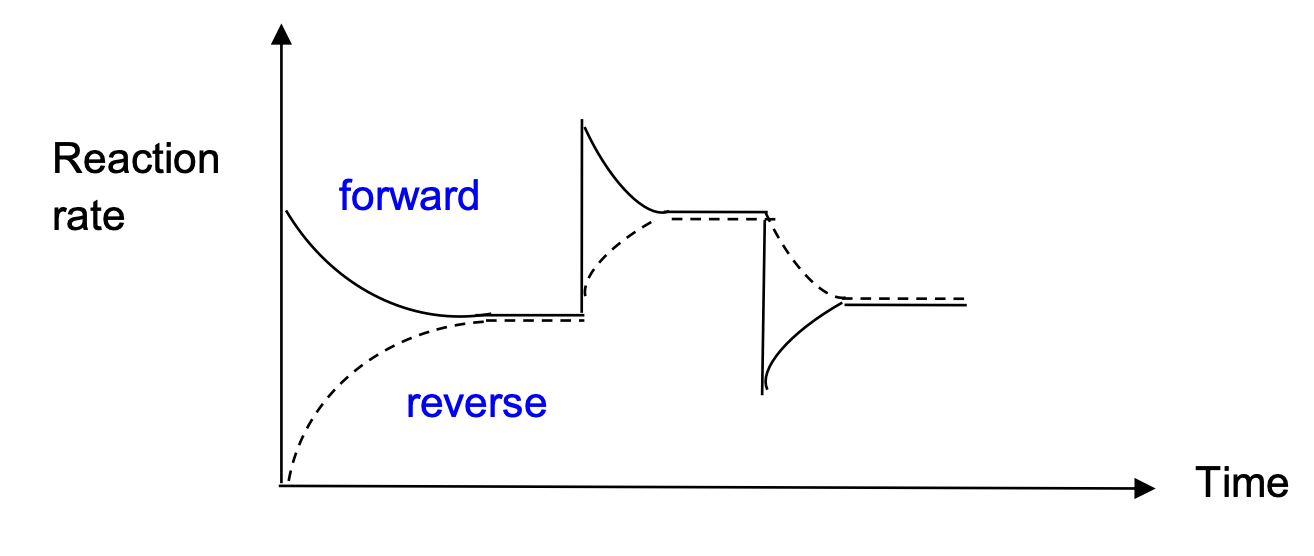
Unlike temperature and pressure, changing concentration only affects one rate immediately — the forward rate jumps when a reactant is added, or the reverse rate jumps when a product is added. The other rate catches up as the system shifts.

04

Reaction Rate vs Time — Catalyst Added

No shift in equilibrium
Reaction rate vs time graph showing both forward and reverse rates increasing equally when a catalyst is added, with no change in equilibrium position
1
Before catalyst — at equilibrium
The forward rate and the reverse rate are equal — dynamic equilibrium is established.
2
Catalyst added
A catalyst increases the rate of both the forward and the reverse reactions equally. Because both rates increase by the same amount, the system does not need to counteract any stress — the equilibrium position does not shift. The concentrations of reactants and products at equilibrium remain unchanged. Equilibrium is re-established immediately at a higher overall rate.
3
Key difference from other disturbances
Unlike temperature, pressure or concentration changes, adding a catalyst does not change the equilibrium position. The value of \(K_c\) is unaffected. The only effect is that equilibrium is reached faster.
Key rule

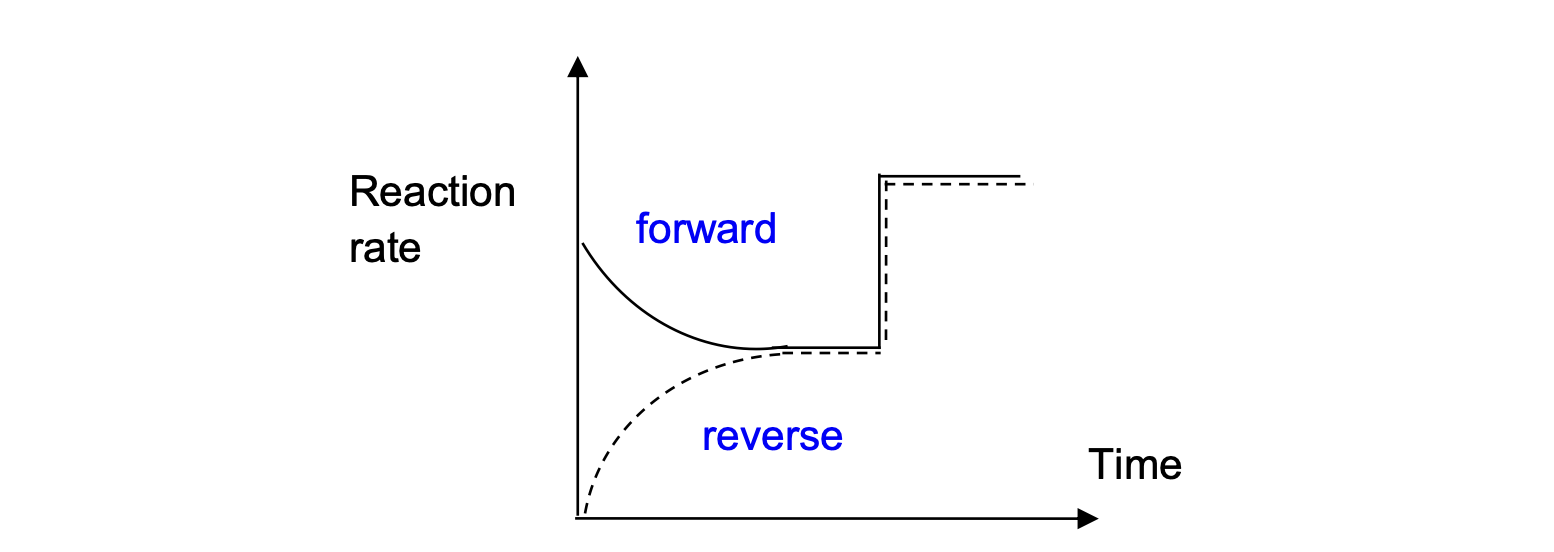
On the graph, both curves jump up by the same amount and remain equal — the two lines stay together. This is the only disturbance where the curves do not cross or converge from different heights.

Concentration vs Time Graphs
\(\text{A}_{(g)} + \text{B}_{(g)} \rightleftharpoons \text{C}_{(g)} \quad \Delta H < 0\)
→ exothermic (forward) ← endothermic (reverse)
How to read these graphs
  • Reactants [A] and [B] — start high, decrease as products form
  • Product [C] — starts at zero, increases until equilibrium
  • Flat lines — equilibrium established; concentrations constant
  • Shift right → [A] and [B] decrease, [C] increases
  • Shift left → [C] decreases, [A] and [B] increase
Moles of gas

Left side: 2 moles of gas (A + B). Right side: 1 mole of gas (C). Pressure increase favours the right; pressure decrease favours the left.

05

Concentration vs Time — Temperature Disturbance

Le Chatelier's Principle
Concentration vs time graph showing [A], [B] and [C] responding to a temperature increase then decrease
1
Before t₁ — reaching equilibrium
The concentrations of A and B decrease as they react to form C. The concentration of C increases from zero. All three concentrations flatten when dynamic equilibrium is established.
2
At t₁ — temperature increase
According to Le Chatelier's principle, an increase in temperature will cause the system to counteract by decreasing the temperature. An increase in temperature favours the endothermic reaction and therefore equilibrium will shift to the left. The concentration of C decreases and the concentrations of A and B increase.
3
At t₂ — temperature decrease
According to Le Chatelier's principle, a decrease in temperature will cause the system to counteract by increasing the temperature. A decrease in temperature favours the exothermic reaction and therefore equilibrium will shift to the right. The concentrations of A and B decrease and the concentration of C increases.
Key rule

Temperature is the only disturbance that changes \(K_c\). A higher temperature gives a new \(K_c\) — the flat lines after the disturbance settle at different ratios, not just shifted by a constant amount.

06

Concentration vs Time — Pressure Disturbance

Le Chatelier's Principle
Concentration vs time graph showing [A], [B] and [C] responding to a pressure increase then decrease
1
Before t₁ — at equilibrium
Concentrations of A, B and C are constant — dynamic equilibrium is established.
2
At t₁ — pressure increase (volume decreased)
An increase in pressure by decreasing the volume of the reaction vessel increases the concentration of all reactants and products. According to Le Chatelier's principle, an increase in pressure will cause the system to counteract by decreasing the pressure. The reaction that produces the least number of moles is favoured and therefore equilibrium will shift to the right. The concentrations of A and B decrease and the concentration of C increases.
3
At t₂ — pressure decrease (volume increased)
A decrease in pressure by increasing the volume of the reaction vessel decreases the concentration of all reactants and products. According to Le Chatelier's principle, a decrease in pressure will cause the system to counteract by increasing the pressure. A decrease in pressure favours the reaction with the most number of moles and therefore equilibrium will shift to the left. The concentration of C decreases and the concentrations of A and B increase.
Key rule

When pressure changes by volume adjustment, all concentrations jump or drop together first (visible as a sudden step on the graph), then they shift toward the new equilibrium.

07

Concentration vs Time — Concentration Disturbance

Le Chatelier's Principle
Concentration vs time graph showing [A] spiking when more A is added, then all concentrations adjusting to a new equilibrium
1
Before t₁ — at equilibrium
Concentrations of A, B and C are constant — dynamic equilibrium is established.
2
At t₁ — more A is added
According to Le Chatelier's principle, when the concentration of one of the reactants is increased the system will react in such a way to decrease the concentration. The reaction using up the extra reactants will be favoured and therefore equilibrium will shift to the right. The concentrations of A and B decrease and the concentration of C increases until a new equilibrium is established.
3
After the shift
Note that the new equilibrium concentration of A is higher than it was before A was added — the system used up some of the extra A, but not all of it. The value of \(K_c\) is unchanged.
Key rule

On the graph, [A] shows a sudden spike when more A is added, then decreases toward the new equilibrium. [B] decreases slightly and [C] increases. Only the species directly added shows the sharp step.

08

Concentration vs Time — Catalyst Added

No shift in equilibrium
Concentration vs time graph showing no change in equilibrium concentrations when a catalyst is added
1
Before catalyst — reaching equilibrium
The concentrations of A and B decrease and [C] increases until equilibrium is established.
2
Catalyst added
Because a catalyst increases both the rate of the forward and reverse reactions equally, there is no change in the concentrations of reactants or products. As quickly as reactants are producing products, products are reacting to produce the reactants again. The equilibrium position does not shift and \(K_c\) is unchanged.
3
Practical use of a catalyst
Although a catalyst does not change the equilibrium position, it allows equilibrium to be reached faster. This is important in industrial processes where time is money — a catalyst improves the rate of production without altering the final yield.
Key rule

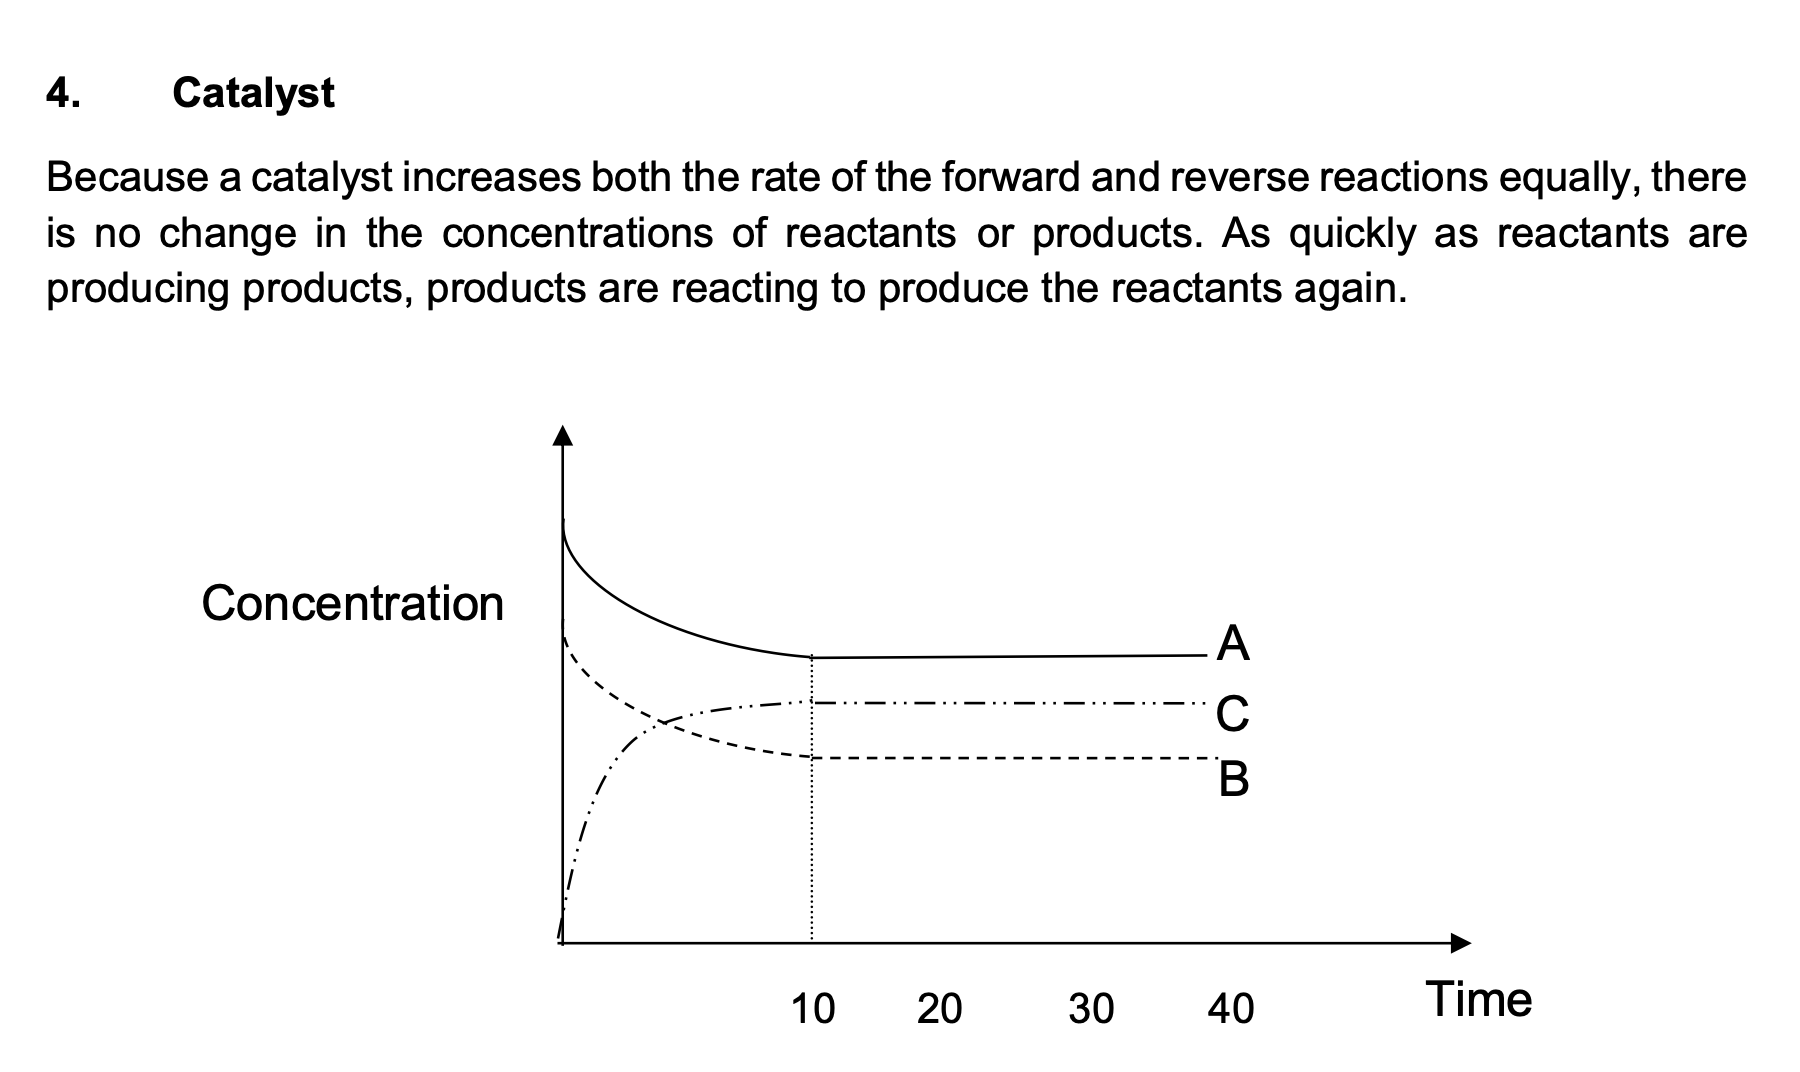
On the concentration vs time graph, adding a catalyst produces no visible change in the flat equilibrium lines — all concentrations remain exactly the same. This graph looks identical before and after the catalyst is added.